🚩 HTB Sherlock - WordpressWebForensics
Executive Summary
- Scenario: A recent server breach has caused significant disruption in your digital environment. You are provided with a Splunk instance loaded with Apache2 access and error logs to investigate how the incident occurred. As a DFIR analyst, you connect to the SIEM and reconstruct how the attacker enumerated, broke into, and backdoored the company’s WordPress site.
- Status:
Completed
Collection
The artifact for this Sherlock is not a file we download but a live Splunk instance. After spawning the target and waiting a minute or two for the services to come up, we connect to the SIEM at http://<ip>:8000 and log in with the provided credentials.
Everything we need lives in a single index, so there is nothing to carve or convert, just a well-stocked SIEM to query.
Examination
Before answering anything, we get a feel for what data we are dealing with. A quick look at the sources tells us the shape of the dataset:
index=* | stats count by index source sourcetype hostindex=main source=/tmp/ingest/access.log* sourcetype=access_combined host=ubuntu
index=main source=/tmp/ingest/error.log* sourcetype=apache_error host=ubuntuSo we have exactly what the scenario promised: Apache2 access logs (access_combined, ~6,900 events) and Apache2 error logs (apache_error, ~200 events), all under index=main. The access logs are the combined format, which conveniently means Splunk already extracts fields like clientip, method, uri_path, status, bytes and useragent for us.
A good first move in any web-log investigation is to see who is talking to the server. The useragent field is perfect for that, because scanning tools love to announce themselves:
index=* | stats count by useragent | sort -countThe very top entry immediately stands out:
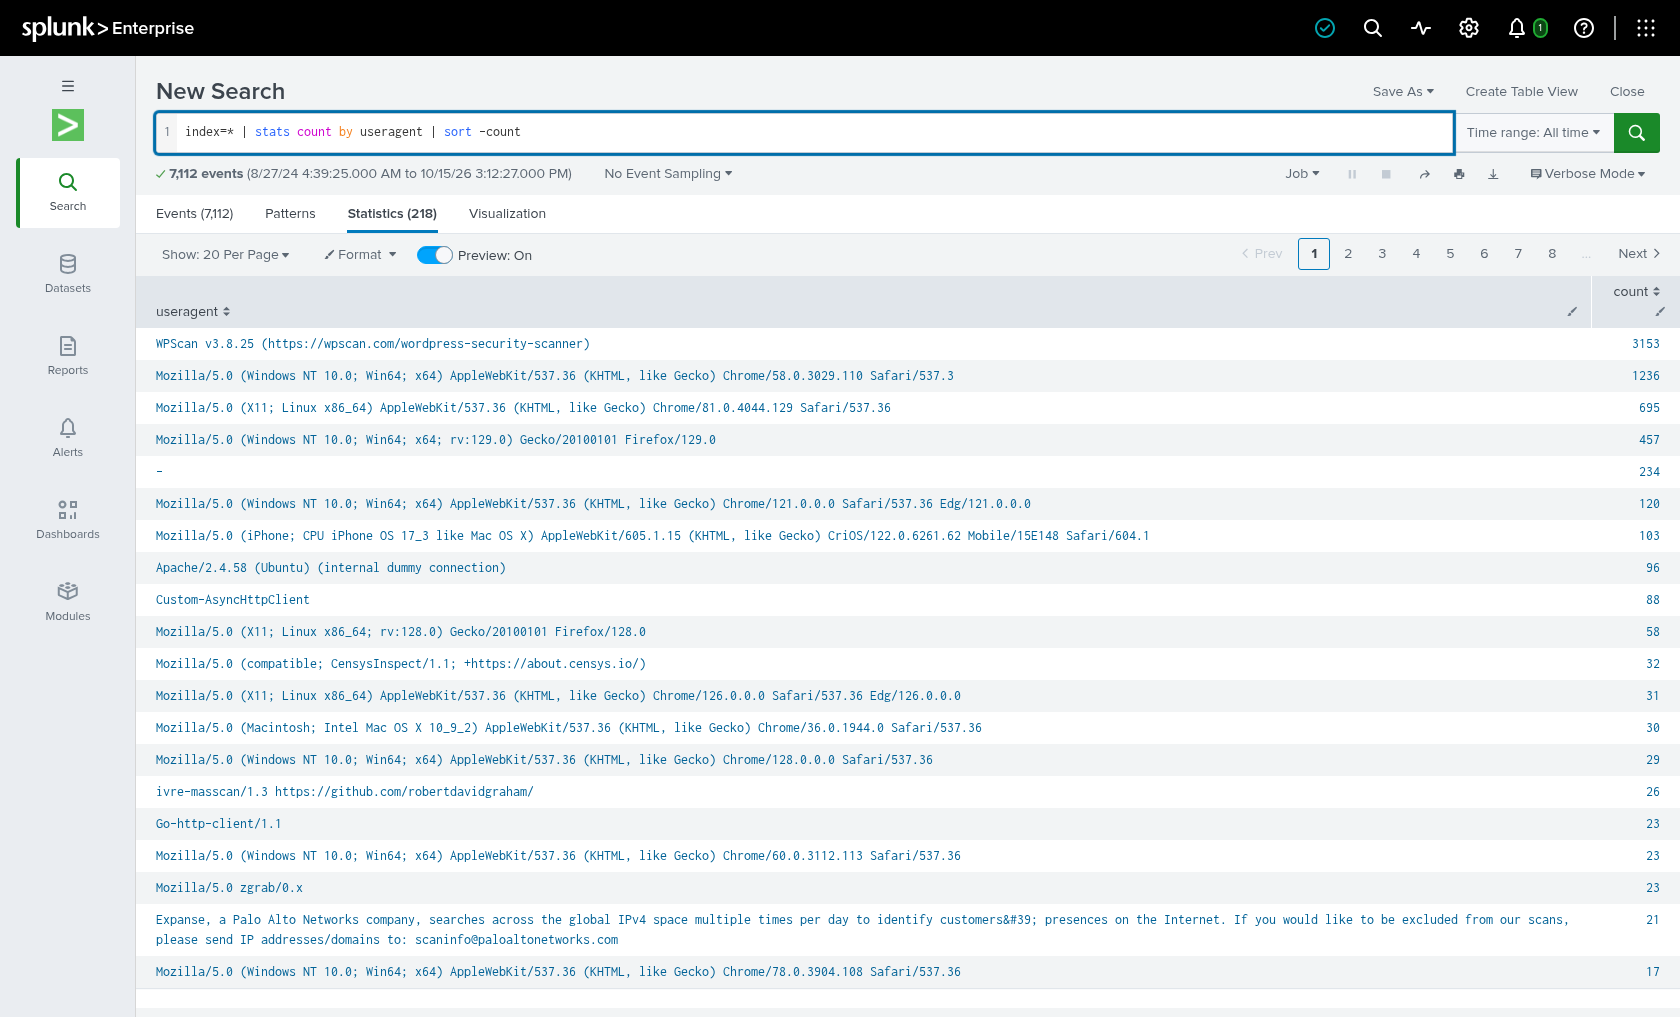
That single line, 3,153 requests from WPScan v3.8.25, answers several questions at once and gives us the thread to pull on for the rest of the investigation.
Analysis - Questions
What is the attacker’s IP address from which the WPScan enumeration originated?
We saw above that a huge chunk of traffic carries the WPScan user-agent. Since WPScan is an aggressive WordPress enumeration tool, whoever is running it is our attacker. We pivot on that user-agent and group by source IP to see who is behind it:
index=main useragent="WPScan*"
| stats count earliest(_time) as first latest(_time) as last by clientip
| eval first=strftime(first,"%F %T"), last=strftime(last,"%F %T")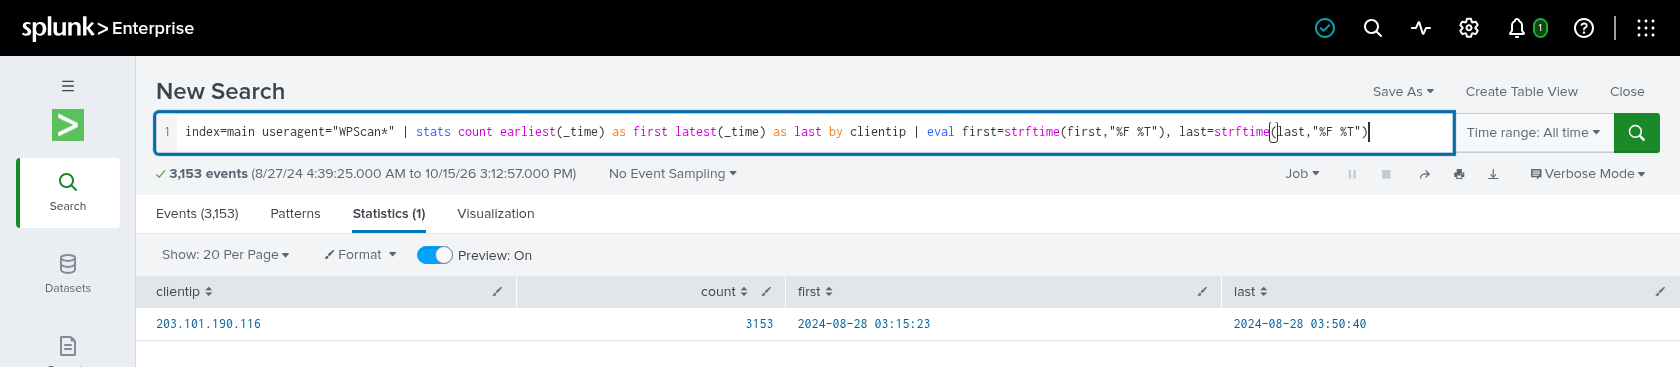
A single IP is responsible for all 3,153 WPScan requests, so there is no ambiguity about who the attacker is.
Answer: 203.101.190.116
When did the attacker begin reconnaissance activity?
The reconnaissance here is the WPScan enumeration itself, the point at which the attacker started actively scanning the WordPress install. We take the same WPScan traffic and look at the very first event:
index=main useragent="WPScan*"
| sort _time | head 1
| eval t=strftime(_time,"%F %T") | table t clientip uri_path status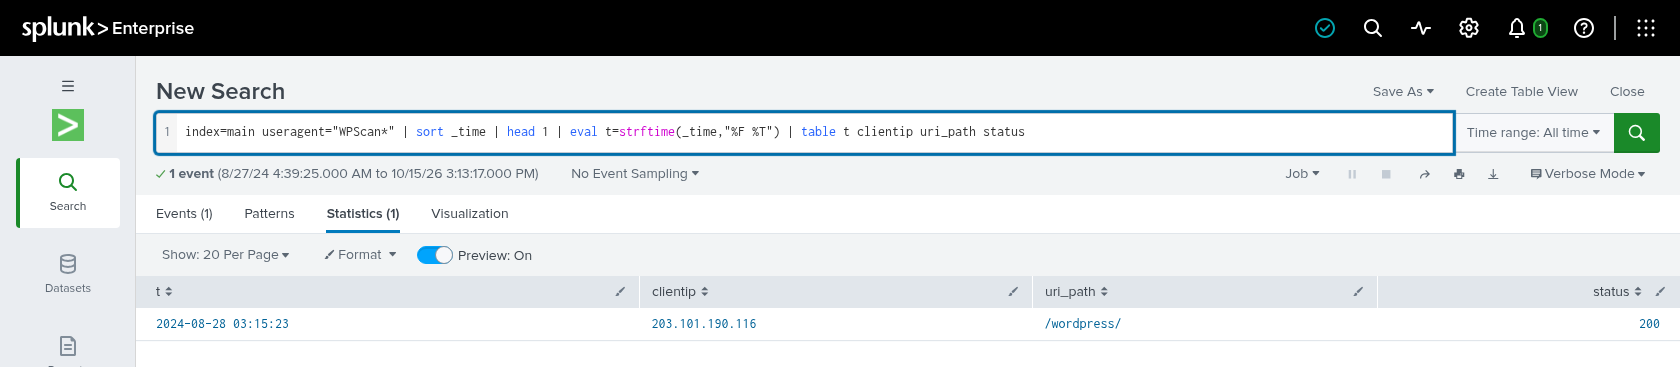
The first WPScan request lands at 03:15:23, which marks the beginning of the reconnaissance phase.
Answer: 2024-08-28 03:15:23
What is the name and version of the tool used by the attacker?
We do not even need another search for this one; the tool politely identifies itself (name and version) right at the top of the user-agent table we pulled in the Examination step:
WPScan v3.8.25 (https://wpscan.com/wordpress-security-scanner)Answer: WPScan v3.8.25
The attacker performed a brute-force attack on the WordPress login form. How many seconds did this activity last for before successfully obtaining valid credentials?
WordPress authentication goes through wp-login.php. The important trick here is understanding the status codes: a failed login simply re-renders the login page and returns HTTP 200, while a successful login redirects the browser to the dashboard and returns HTTP 302. So the brute force is a flood of 200s, and the moment valid credentials are found is the first 302.
We isolate the attacker’s POST requests to the login form and look at the timeline:
index=main uri_path="*wp-login.php" method=POST clientip="203.101.190.116"
| stats earliest(_time) as f latest(_time) as l count by status
| eval f=strftime(f,"%F %T"), l=strftime(l,"%F %T")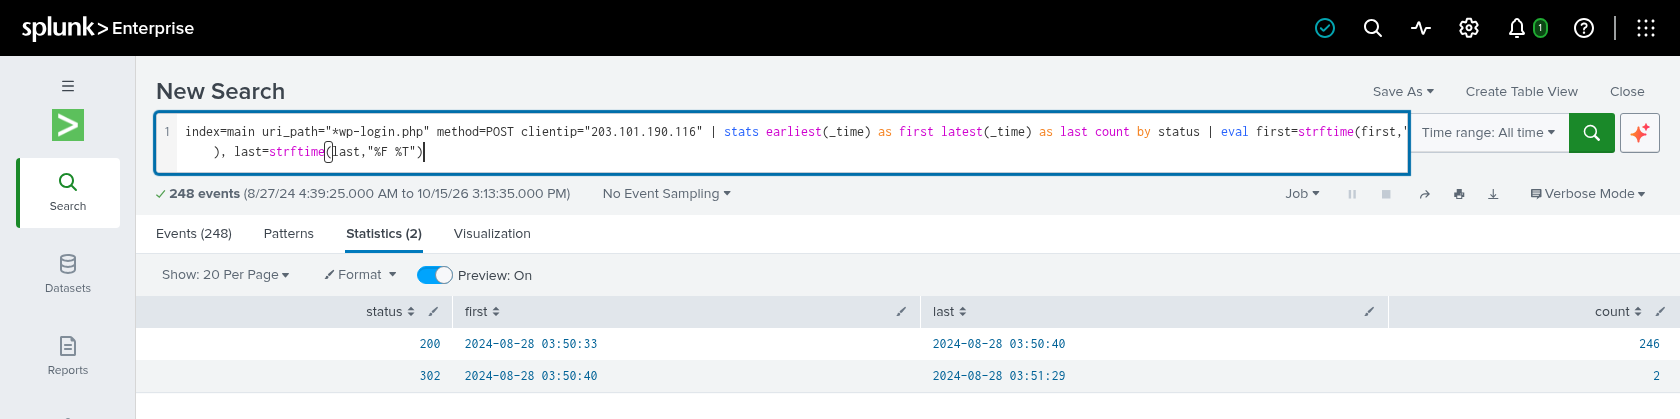
The brute force begins with the first POST at 03:50:33 (the 200 failures) and the first successful 302 arrives at 03:50:40. That is a difference of exactly 7 seconds, which tells us this was a very small, targeted wordlist rather than a blind spray.
Answer: 7
The attacker manipulated a WordPress theme file to maintain persistent access by uploading a web shell. Which WordPress theme was targeted?
With valid admin credentials, the attacker logged into wp-admin and abused the built-in Theme Editor to drop a web shell into a theme file. To find which theme, we look for any PHP file being requested from inside the themes directory:
index=main uri_path="*/themes/*.php"
| stats count by uri_path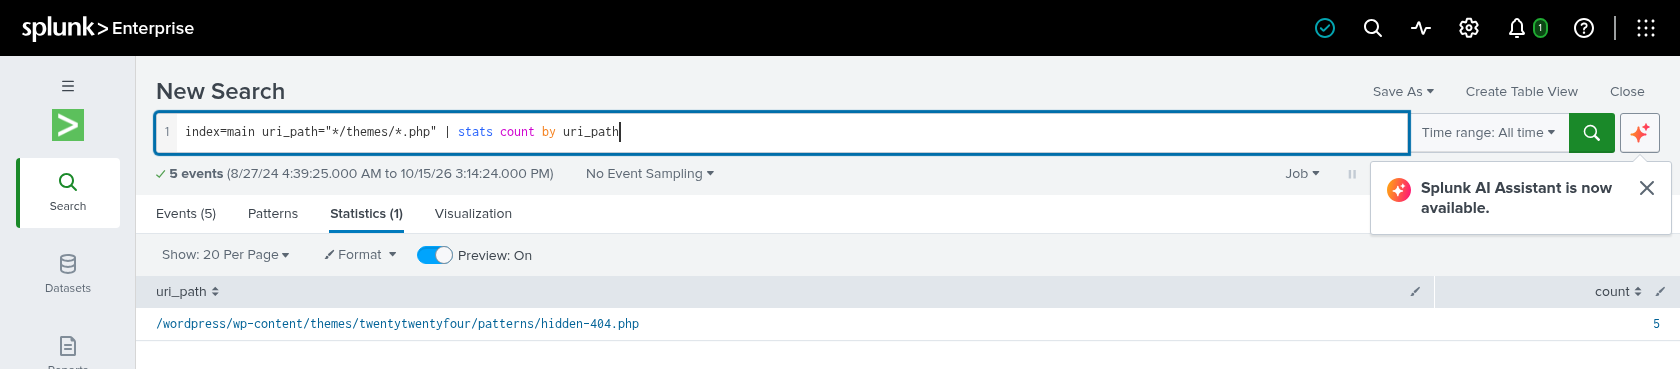
The only theme PHP file touched sits inside the default twentytwentyfour theme.
Answer: twentytwentyfour
What is the name of the PHP theme file the attacker edited and used as a web shell entry point?
The same result gives us the file. Rather than editing something obvious like index.php, the attacker hid their shell in a pattern file named to blend in with a normal 404 page:
/wordpress/wp-content/themes/twentytwentyfour/patterns/hidden-404.phpAnswer: hidden-404.php
We see few POST requests to the suspected PHP file that the attacker supposedly edited… When did the attacker first run a command? Provide an answer based on the patterns in the log.
A web shell is only used when the attacker sends it data, and over HTTP that means a POST request. A plain GET just loads the file in the browser. We pull every request to the shell and watch the method:
index=main uri_path="*hidden-404.php"
| sort _time
| eval t=strftime(_time,"%F %T")
| table t method status clientip useragent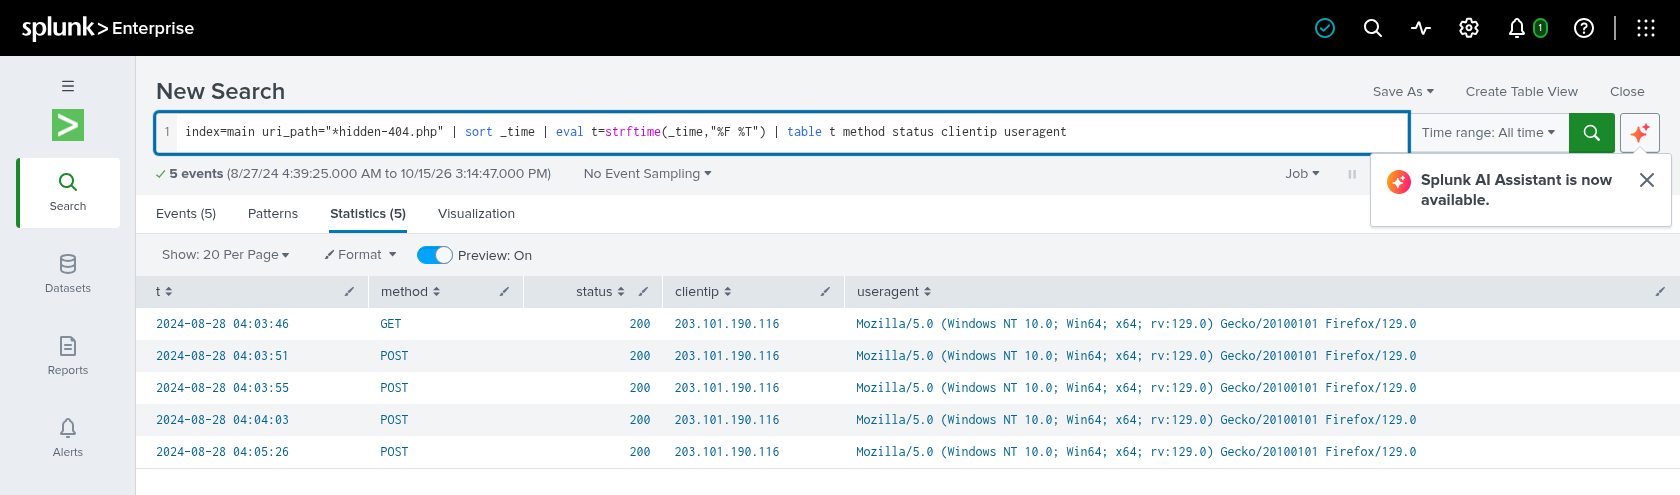
The GET at 04:03:46 is just the attacker opening the shell. The series of POSTs a few seconds apart is the attacker typing commands and reading the output, exactly the pattern the question hints at. The first command is therefore the first POST, at 04:03:51.
Answer: 2024-08-28 04:03:51
List the user-agent used to access the webshell.
Every request to hidden-404.php in the result above comes from the same browser user-agent, which is the attacker’s real Firefox rather than the WPScan tool:
Mozilla/5.0 (Windows NT 10.0; Win64; x64; rv:129.0) Gecko/20100101 Firefox/129.0Answer: Mozilla/5.0 (Windows NT 10.0; Win64; x64; rv:129.0) Gecko/20100101 Firefox/129.0
References: Link